
How to show week number columns in a Microsoft Project schedule
Use custom fields to add start date and/or finish date week number columns, e.g. a column to show date in the format “2021 Week 10”, in a Microsoft project schedule

Display summary task percent complete when all subtasks are milestones in Microsoft Project
When all subtasks in Microsoft Project are milestones, the summary task percent complete is always 0% unless all the subtasks are 100%. The workaround in this tutorial will display a % complete based on number of milestones completed.

Monte Carlo Simulation, Schedule Overrun & Construction Schedule Enhancement
What are the key points to consider when creating a construction project schedule? Do you know how to perform a Monte Carlo analysis on your project schedule? These are addressed in our latest roundup of blog posts from other sites.

Baseline Execution Index (BEI) in Microsoft Project
Baseline Execution Index (BEI) is one of the metrics in the DCMA 14-Point Assessment for project schedules and in this post, we are going to look at how to calculate and display BEI in a Microsoft Project schedule.
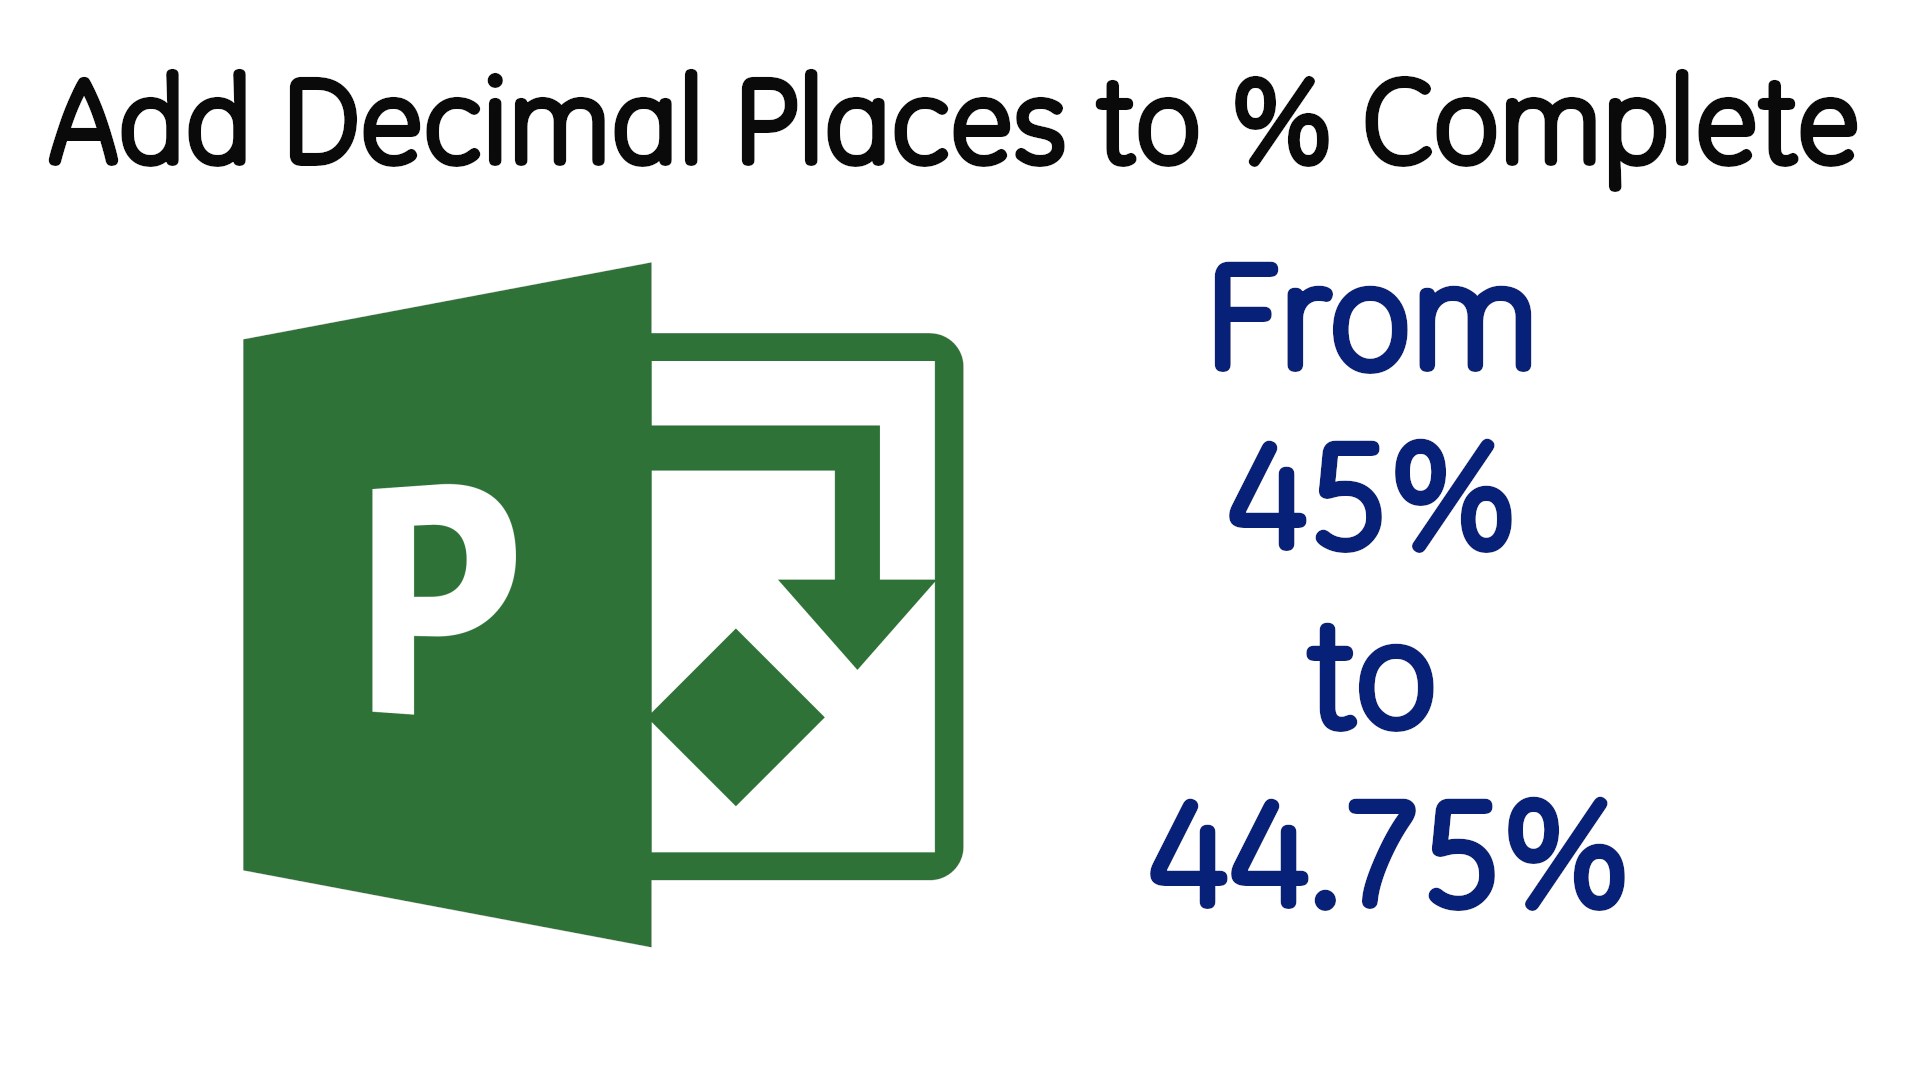
Add Decimal Places to Microsoft Project % Complete
By default, Microsoft Project does not display task % complete numbers with decimal places. In this tutorial, you will learn how to add decimal places to % complete using custom fields.

7 Tips for Effective Power BI Dashboards
Dashboards are important when it comes to summarising data for quick insights therefore your choice of visualisations becomes key in how effective your dashboards are.

Which Way is Critical Path?
Do you have an opinion on the state of CPM project schedules? Do you know why false critical paths are abound in schedules?

Microsoft Project Critical Path Myth
Do you know that Microsoft Project does not display Critical Path? Do you want to know more about Critical Path myth in Microsoft Project?

Microsoft Project Progress Status Traffic Light (RAG Status)
Learn how to use Custom Fields to display traffic light (RAG Status) for progress status of tasks in a Microsoft Project schedule.

Microsoft Project Baseline Percent (%) with Weighted Summary Roll-up
The workaround in this tutorial is for Primavera P6 Users looking for ways to display a baseline % complete column in Microsoft Project. This workaround also shows how to roll-up summary tasks % complete.

Excel Pimps Up Conditional Formatting
Good news for Planners and Scheduler who depend on Excel for reporting as the Conditional Formatting gets a makeover with resizable dialog box and ability to duplicate rules.
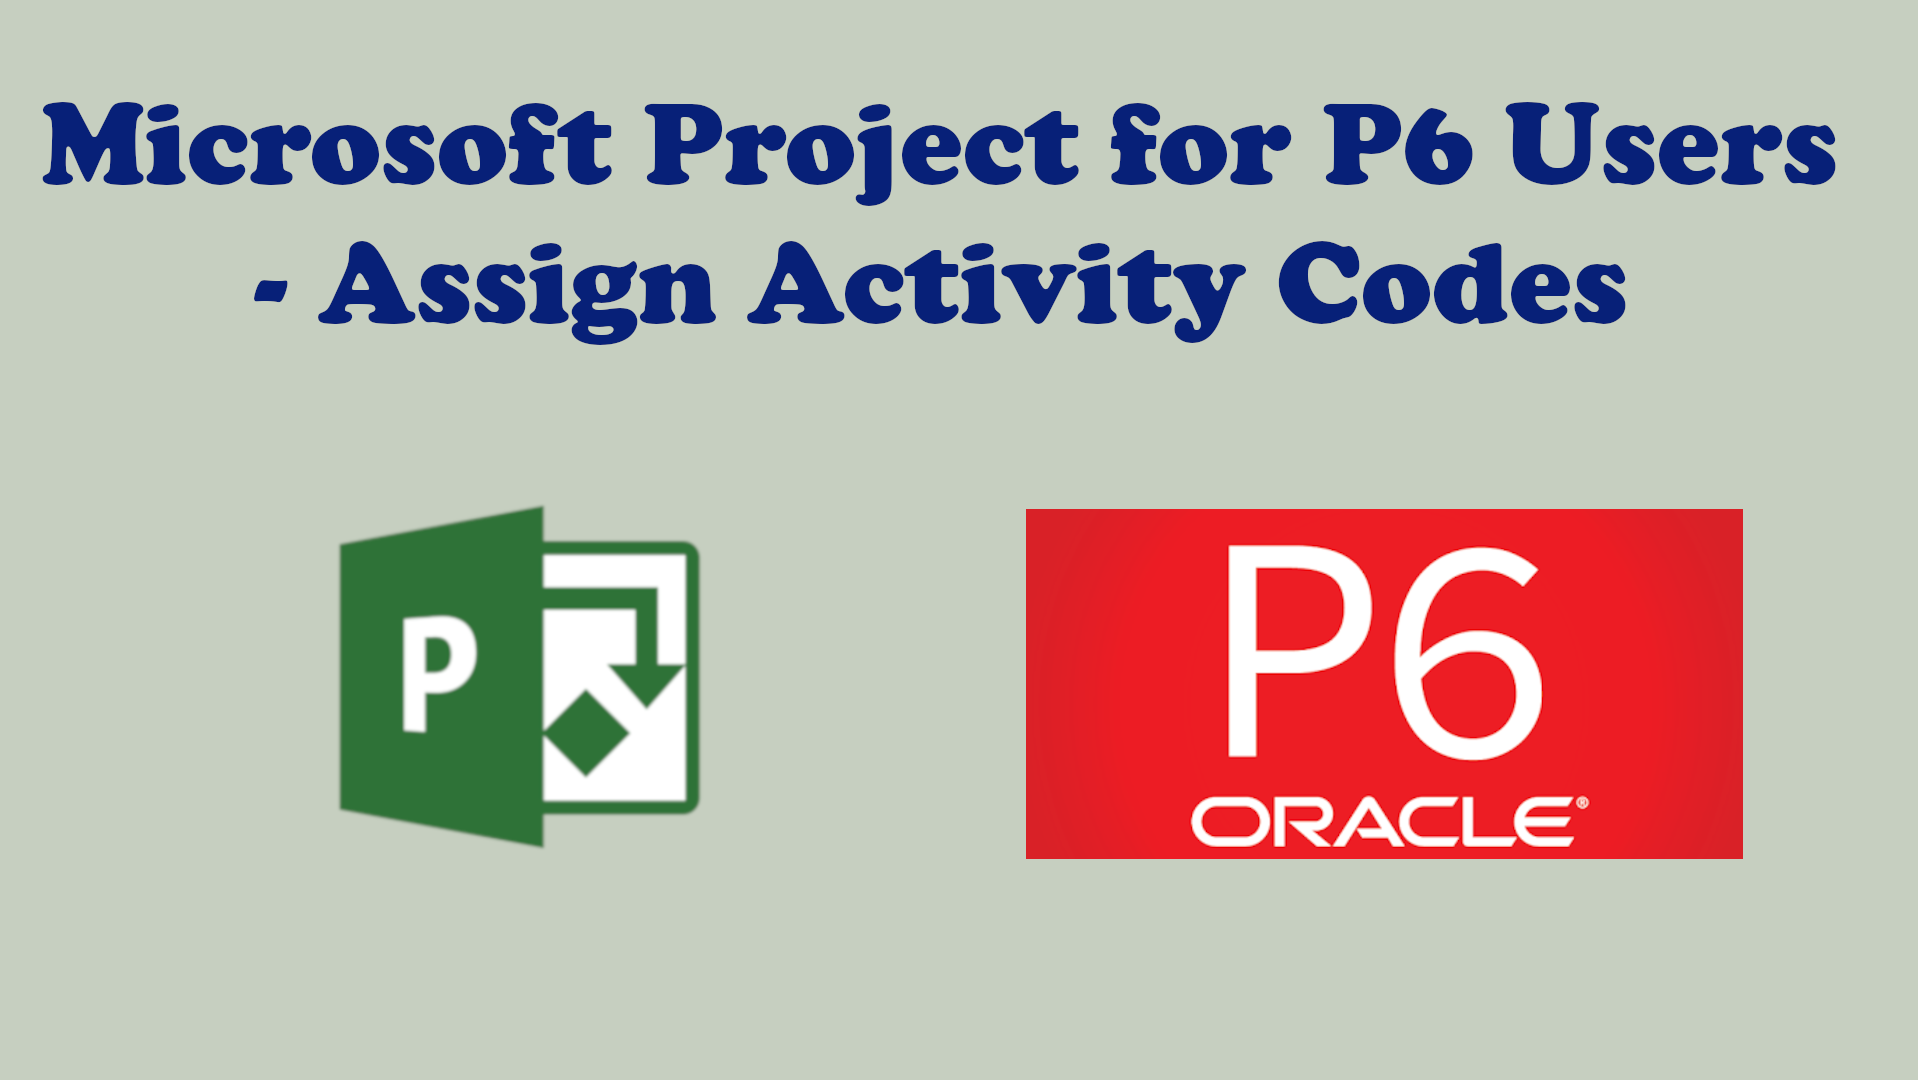
Microsoft Project for P6 User – Assign Activity Codes
Learn how to use Custom Fields to replicate Primavera P6 Activity Codes to enable grouping and/or filtering of tasks in Microsoft Project.

Schedule Risk Analysis, Record Keeping and Liquidated Damages
This week’s review of blogsphere brings you posts about risk analysis, importance of keeping records when it comes to EOT and the advantages of LD clauses. If you like pie-charts, then you might want to read why they are considered ugly.

Ways to achieve on-time project delivery and types of construction contracts
This week’s review features one of the best articles I have read in a long time and it is from Planning & Scheduling experts, Glen Palmer and Chris Carson. You want to read about their recommended approaches to a successfully on-time delivery of projects.

Why You Should Build a New Project Schedule from Scratch
When it comes to building a new project schedule, while it is very tempting to use a copy of an existing schedule from a previous project of similar scope and adapting it to suit, I would advise against it.

10 Excel Functions Junior Planners and Schedulers should be using
Microsoft Excel is a powerful analytical and reporting tool and here are 10 Excel functions I think budding Project Planners & Schedulers should be using.

Quality Project Data, Effective Site Communication and Integrated Risk Analysis
This week’s review highlights the need for good quality project data and the advantages of integrating schedule & cost risk analysis. It also discusses how to prevent and expediate claims on construction projects as well as how to improve communication at construction sites.

Time Location Charts, Free Template & Mini-Course
Read about the LinkedIn discussion on the use of Time Location charts on Linear Projects & get links to a free template & mini-course on planning processes